RUNNING COACHES
Online and in-person.
Add an athlete, and FlowData reads their device files alongside your written prescription - one personalized report per athlete, without building the analysis by hand.
FLOWDATA · ELITE RUNNING ANALYTICS
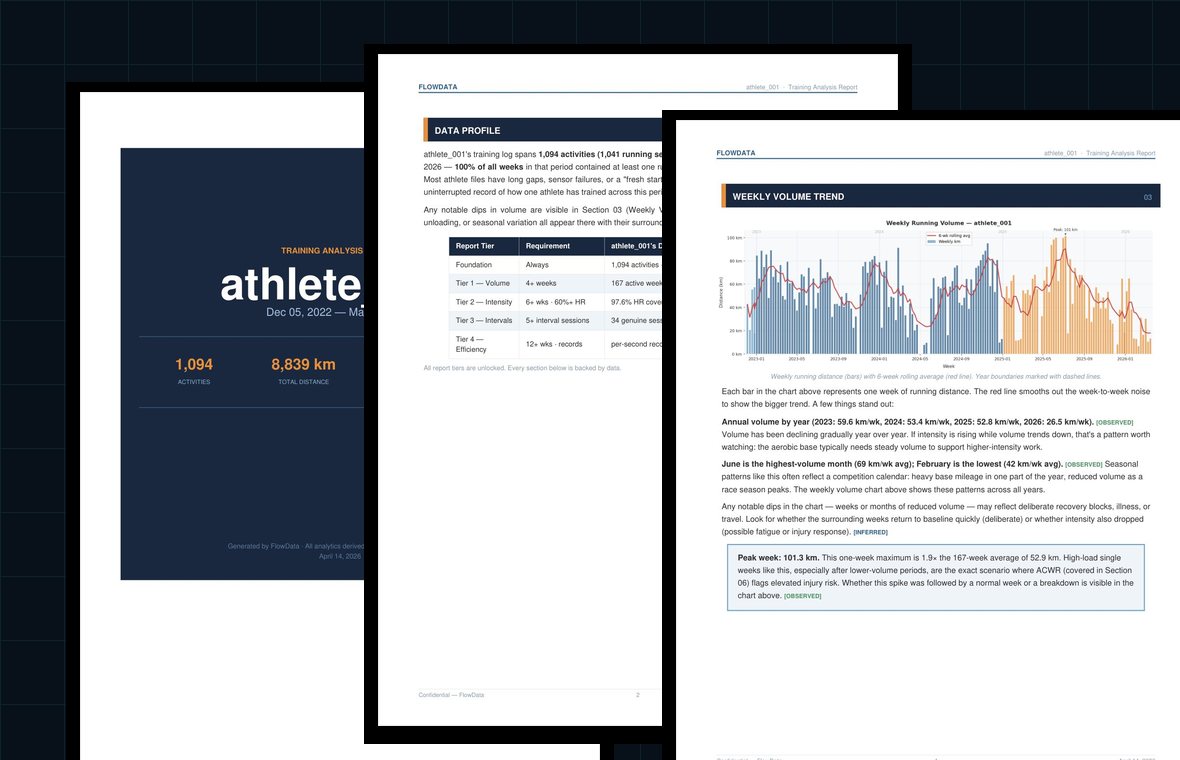
Sourced, visual, published reports of elite training — load, intensity, structure, and pattern.
THE ARTIFACT
Each report reads like editorial analysis — charts paired with plain-language readings and visible source labels.
SAMPLE ANALYSIS
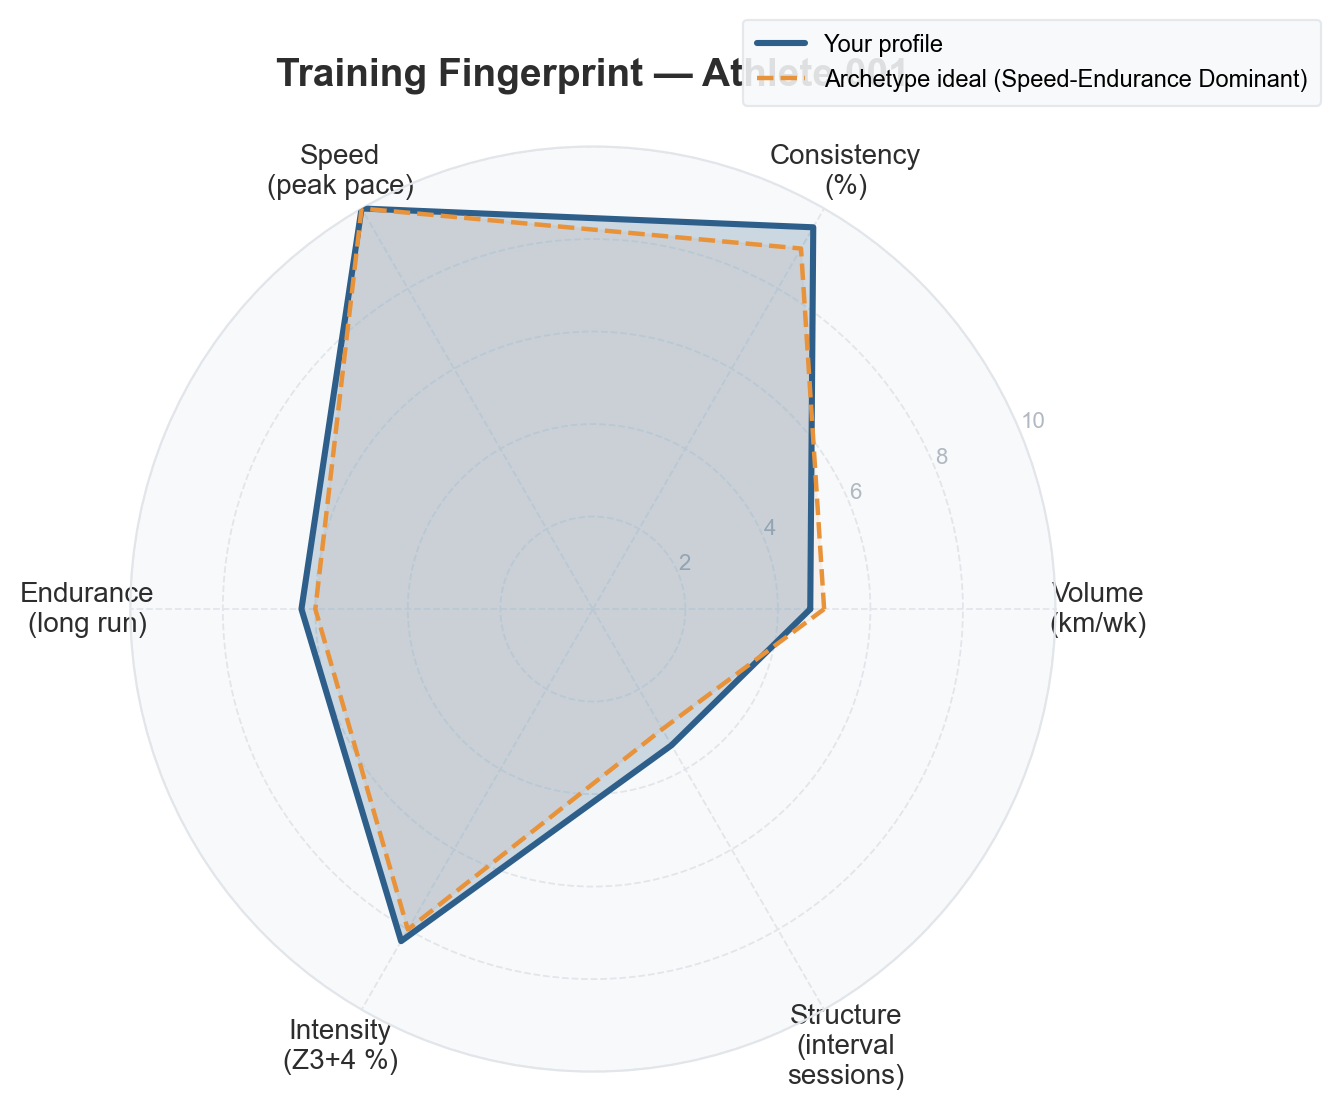
Volume, consistency, speed, endurance, and intensity scored against a goal-specific ideal shape.
Source: athlete_001 · Anonymized
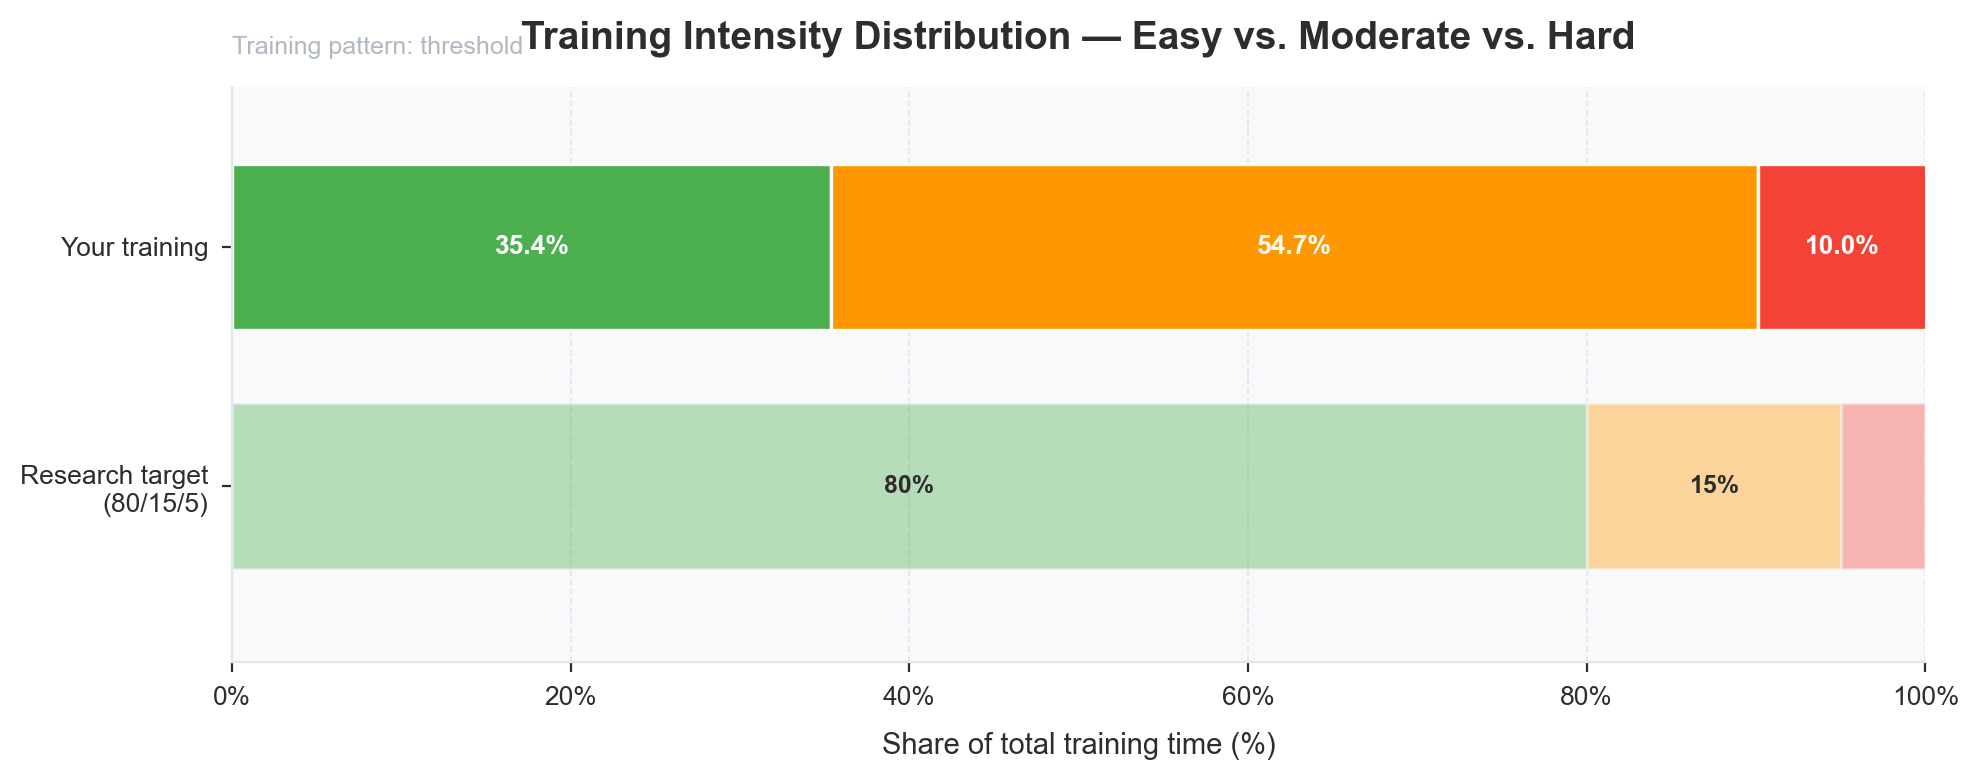
Actual zone time against the research-recommended 80/15/5 split, with architecture classification.
Source: athlete_001 · Anonymized
FLOWDATA ANALYSIS
RUNNING COACHES
Add an athlete, and FlowData reads their device files alongside your written prescription - one personalized report per athlete, without building the analysis by hand.
PT & GAIT CLINICS
Add a patient's training history alongside your clinical notes and get a structured read on load, intensity, and pattern to support the sessions you're already running.
HOW IT WORKS
Device files and written context come together into the same source-labeled, confidence-tagged report format used across FlowData.
ELITE INSIGHTS
Editorial reports on how elite runners actually train - sourced from athlete-submitted data, written for fans, coaches, and the athletes themselves, and released only with athlete approval.
TRUST AND PRIVACY
No Elite Insights report goes live without athlete review and explicit approval on the published version.
Identity, GPS routes, and private health detail are removed before any report is published or reviewed.
Every finding is labeled OBSERVED, INFERRED, or PREDICTED. No hidden assumptions.
Data comes from athletes who consented to the analysis scope. Never from platform scraping or third-party feeds.
TWO WAYS IN
FlowData works both ways: brought in by a coach or clinic for their own athletes, or published with an elite athlete's approval.