FLOWDATA SAMPLE REPORT

See what the data becomes.

Meet Morgan Hale, a fictional marathon runner built to demonstrate the complete FlowData analysis experience. Every metric, date, event, and training pattern in this report is synthetic.

Synthetic demonstration No real athlete, account, route, location, or health history.

Complete 26-page report · PDF · 1.5 MB

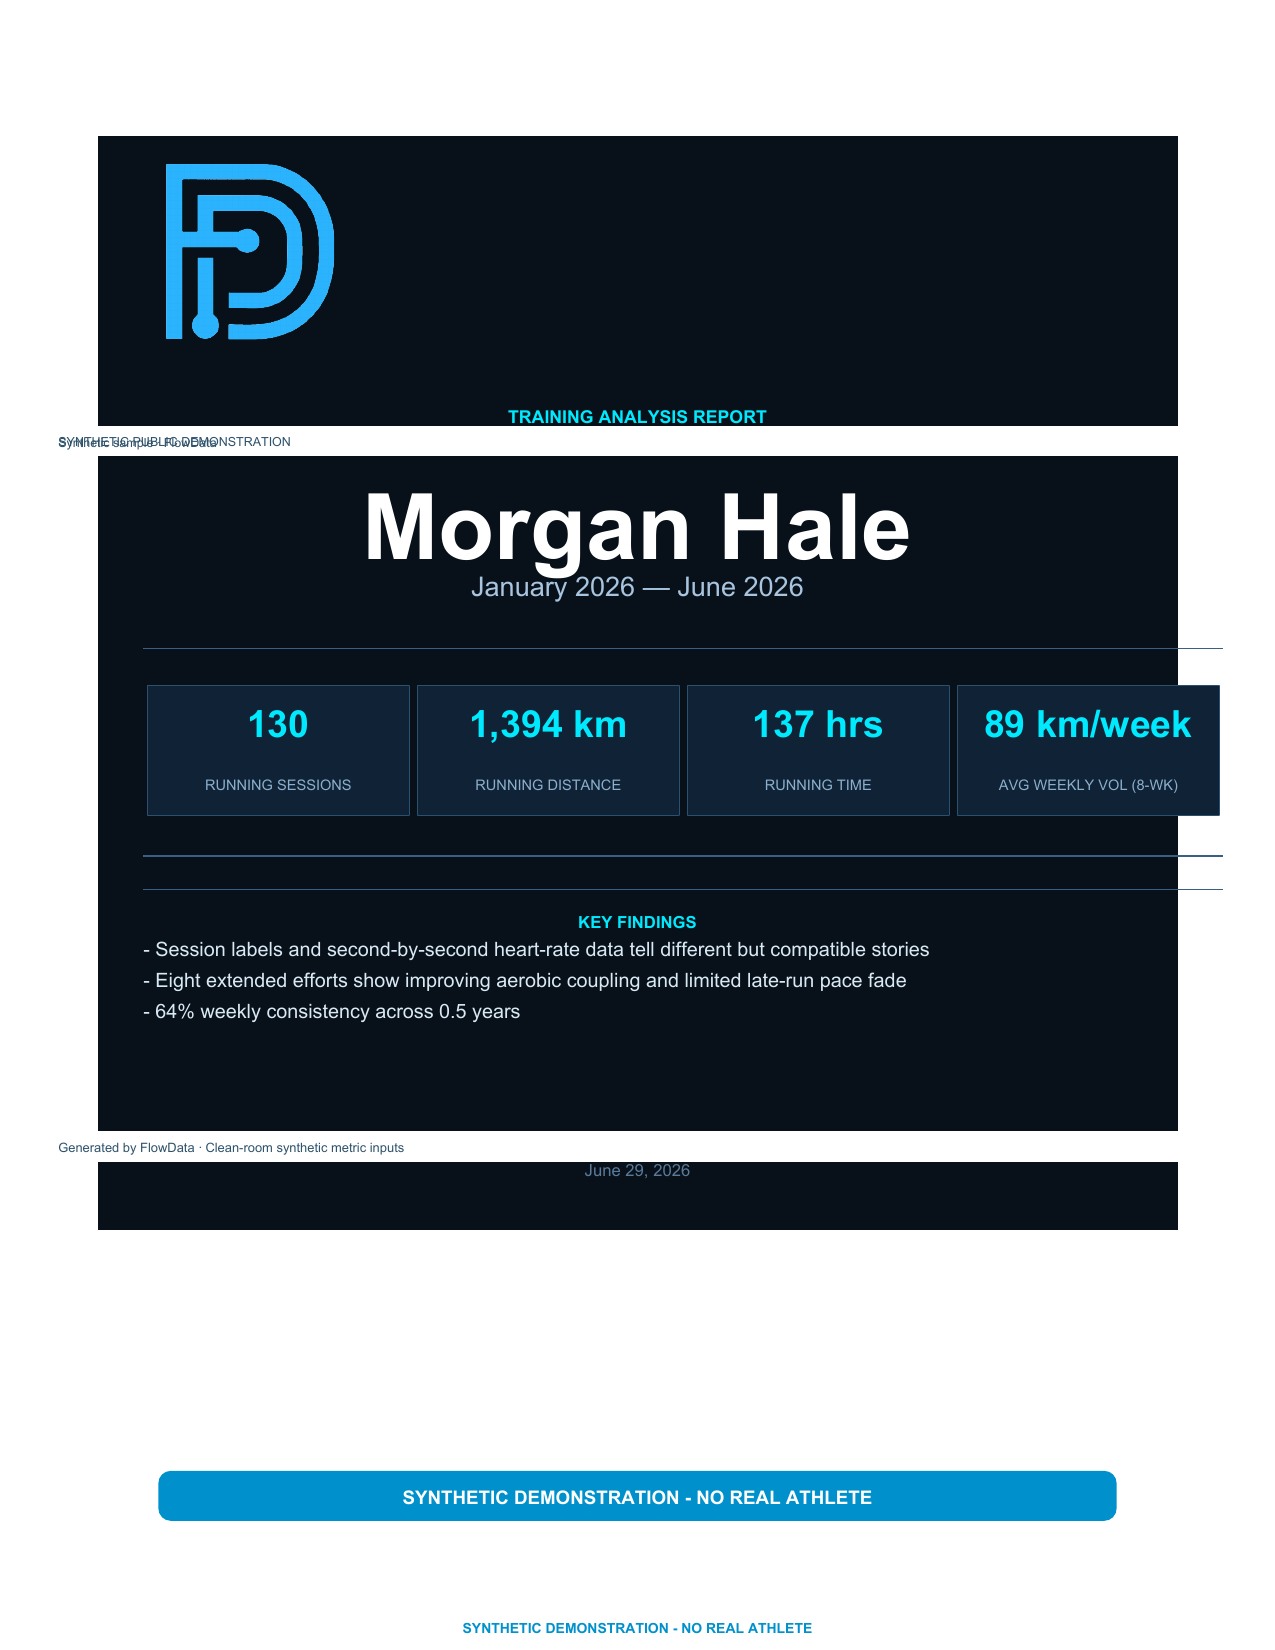
Morgan Hale synthetic FlowData report cover with training-window summary metrics.
Morgan Hale · fictional demonstration athlete Same analysis engine · entirely synthetic inputs

A GUIDED READ

Six moments that make a report useful.

Each page answers two questions: what does the analysis show, and why should a runner, coach, or clinic care?

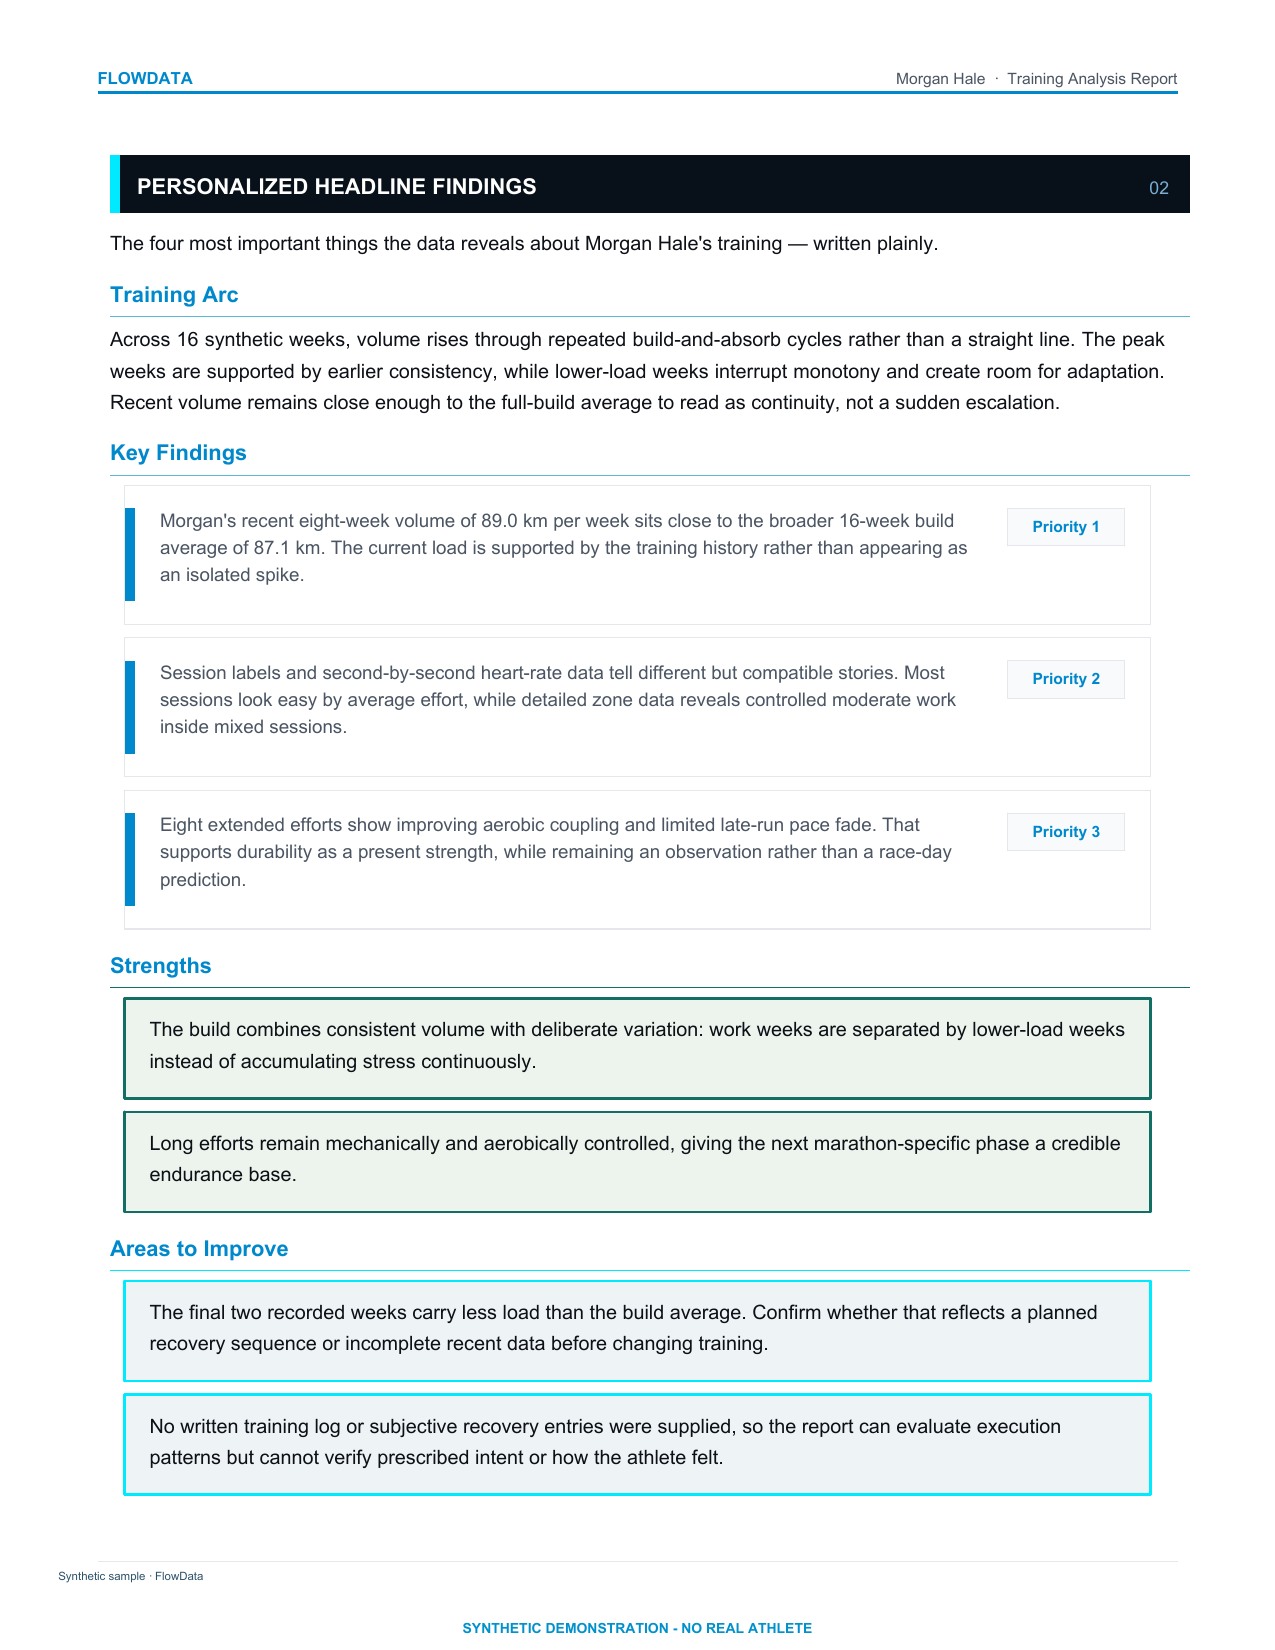
Morgan Hale synthetic report page showing prioritized headline findings, strengths, and areas to improve. Open larger

01

Headline findings

The report begins with the decisions hidden inside the charts: what is supported, what needs attention, and where the evidence is incomplete.

A coach or runner can start with the few signals that change the next conversation instead of interpreting dozens of disconnected charts.
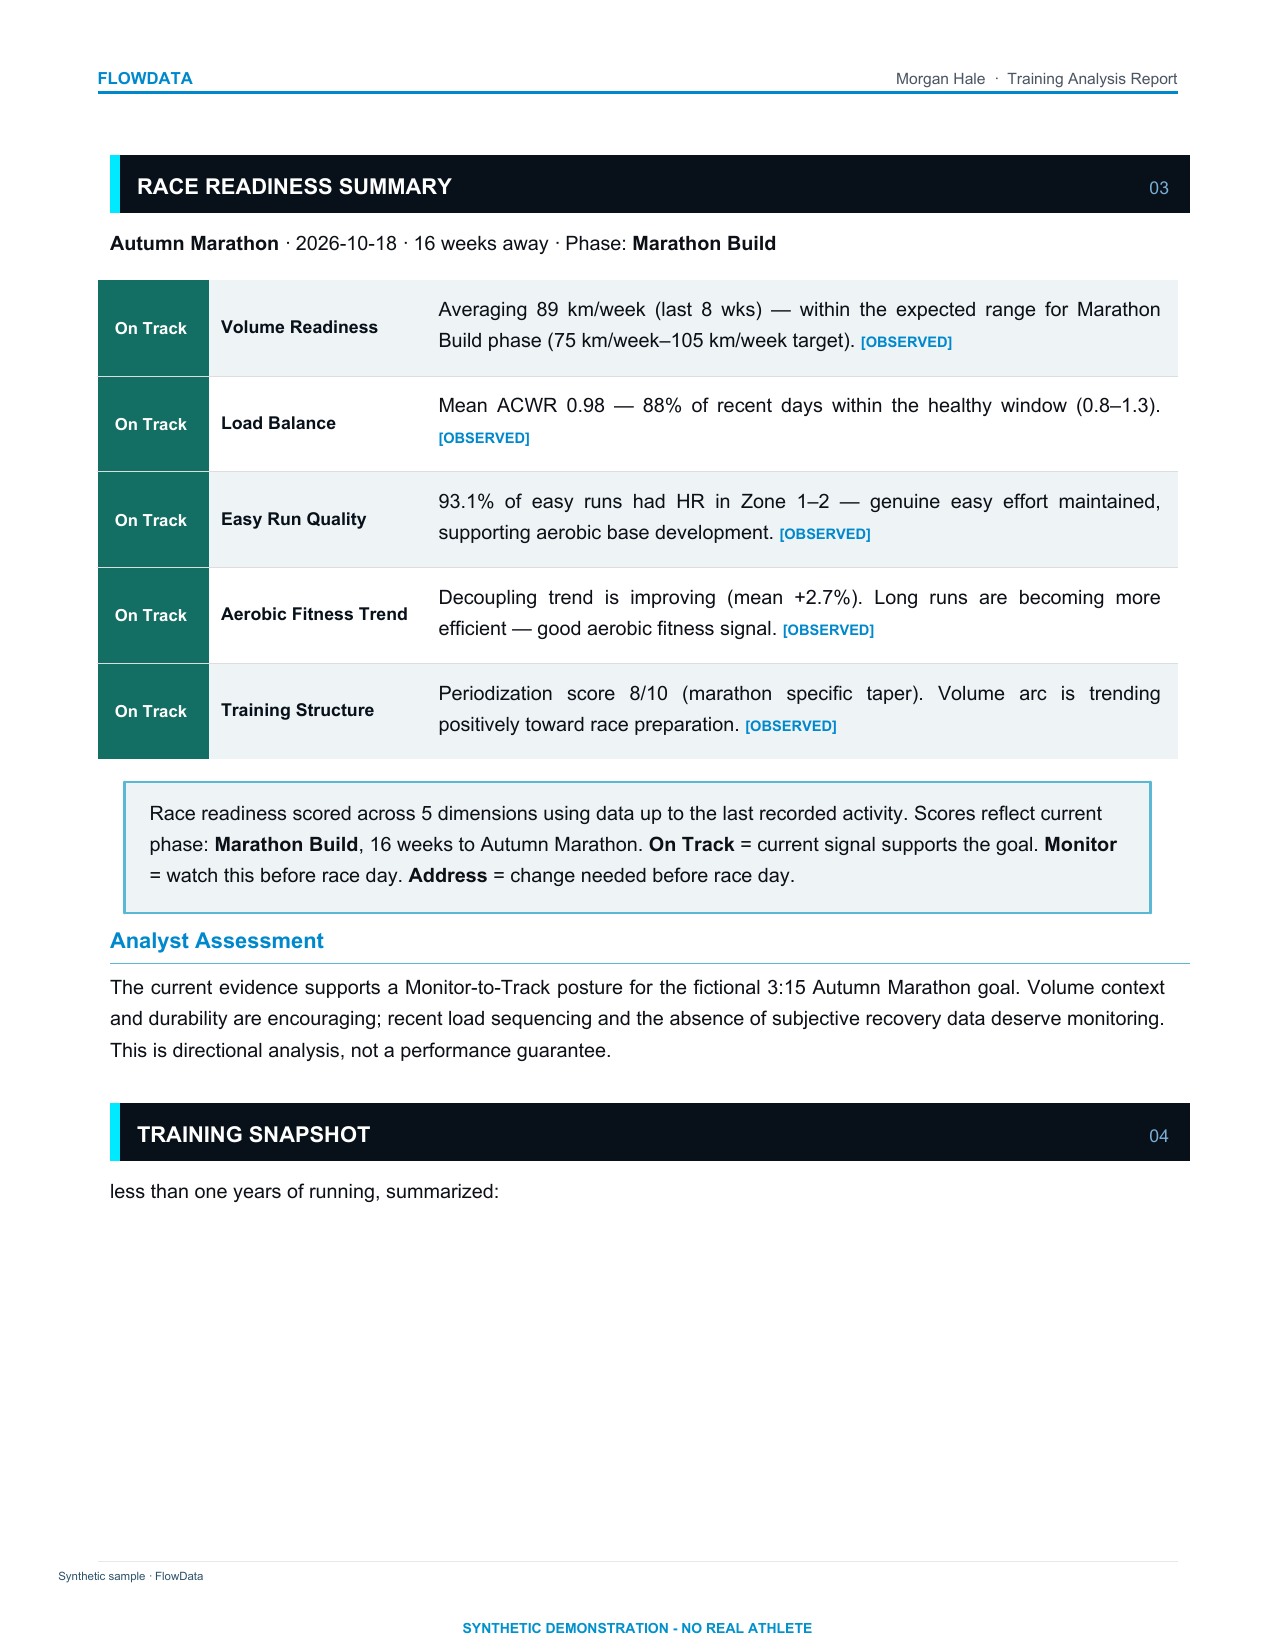
Morgan Hale synthetic race-readiness scorecard with track, monitor, and address status signals. Open larger

02

Race readiness

Goal context is translated into a scorecard covering volume, load balance, durability, and specific preparation.

The status language separates encouraging evidence from conditions that should be monitored or addressed before the goal race.

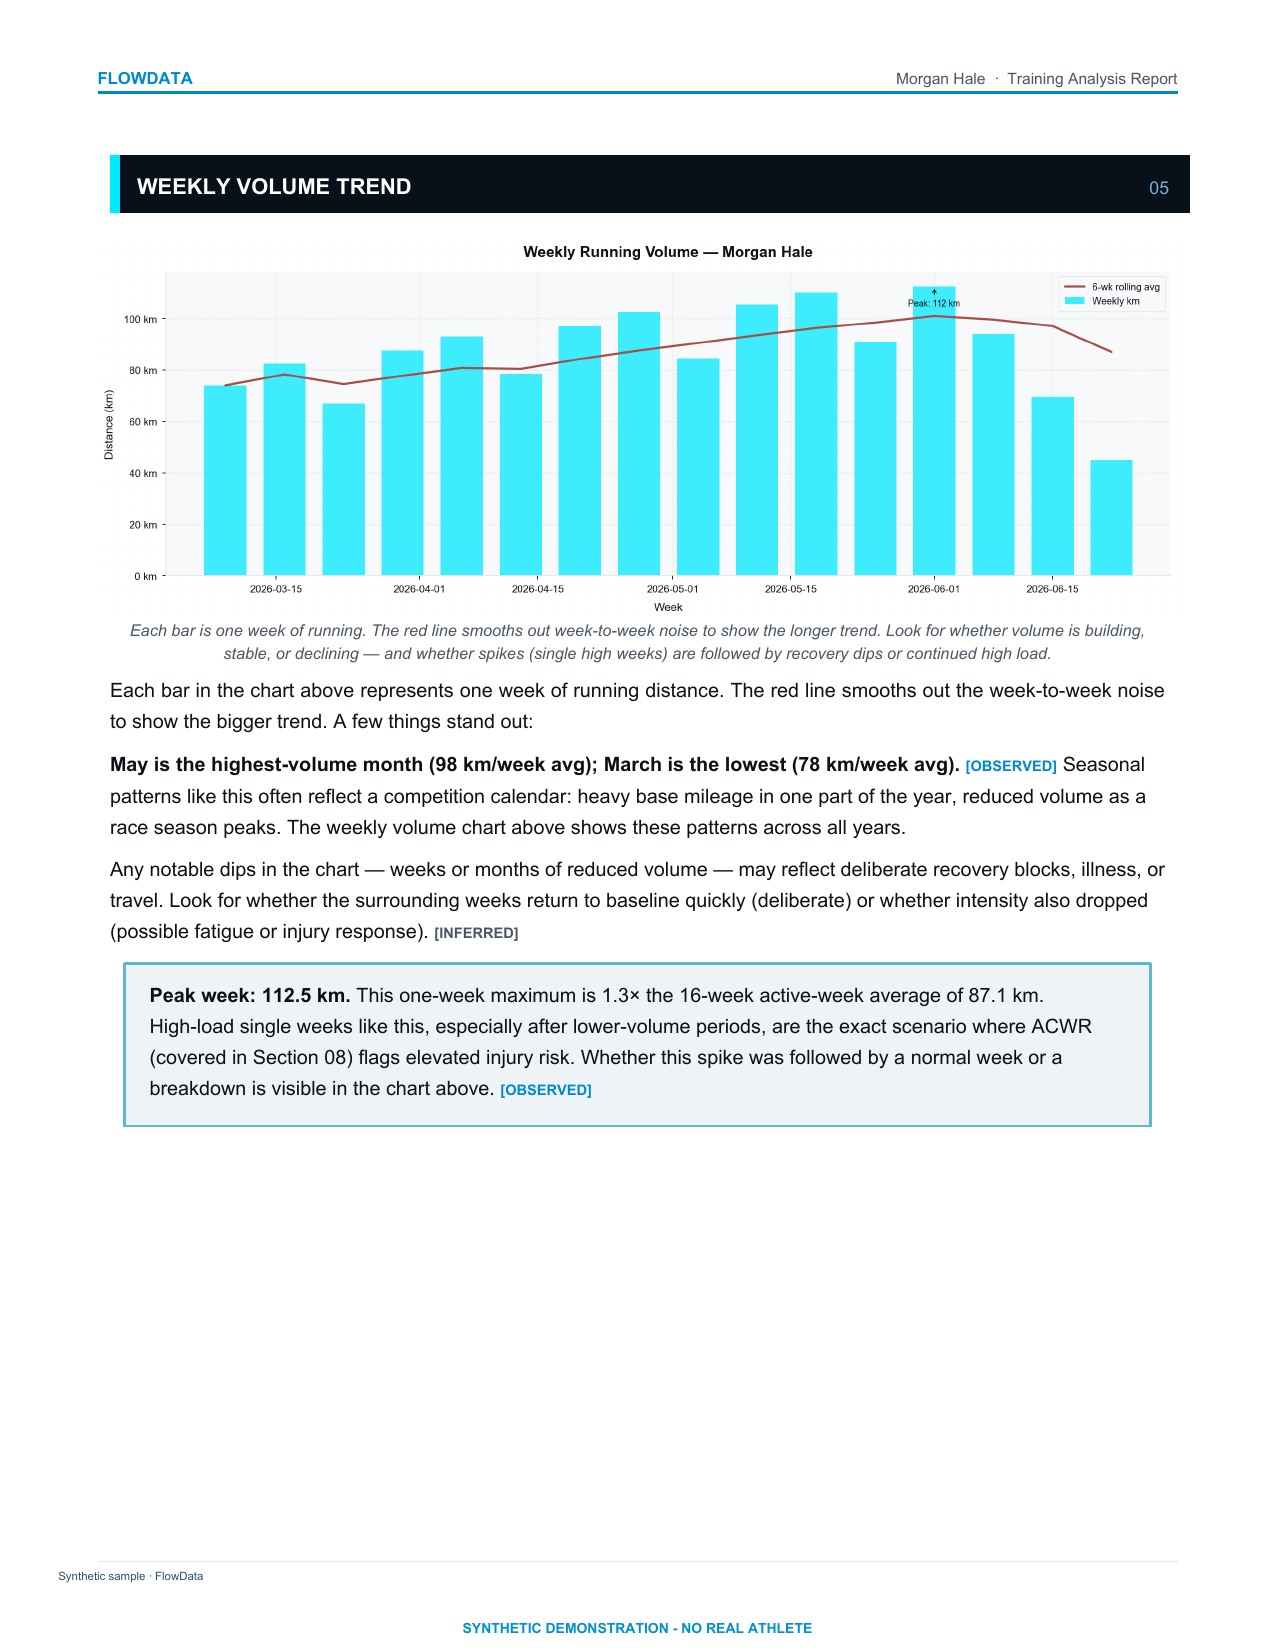
Morgan Hale synthetic weekly-volume report page showing a sixteen-week marathon build and recovery weeks. Open larger

03

Training arc and volume

Weekly mileage is read as a sequence: builds, absorption weeks, peaks, and the current eight-week context.

The same 91-kilometer week can mean stability or a spike. Longitudinal context is what makes the number useful.

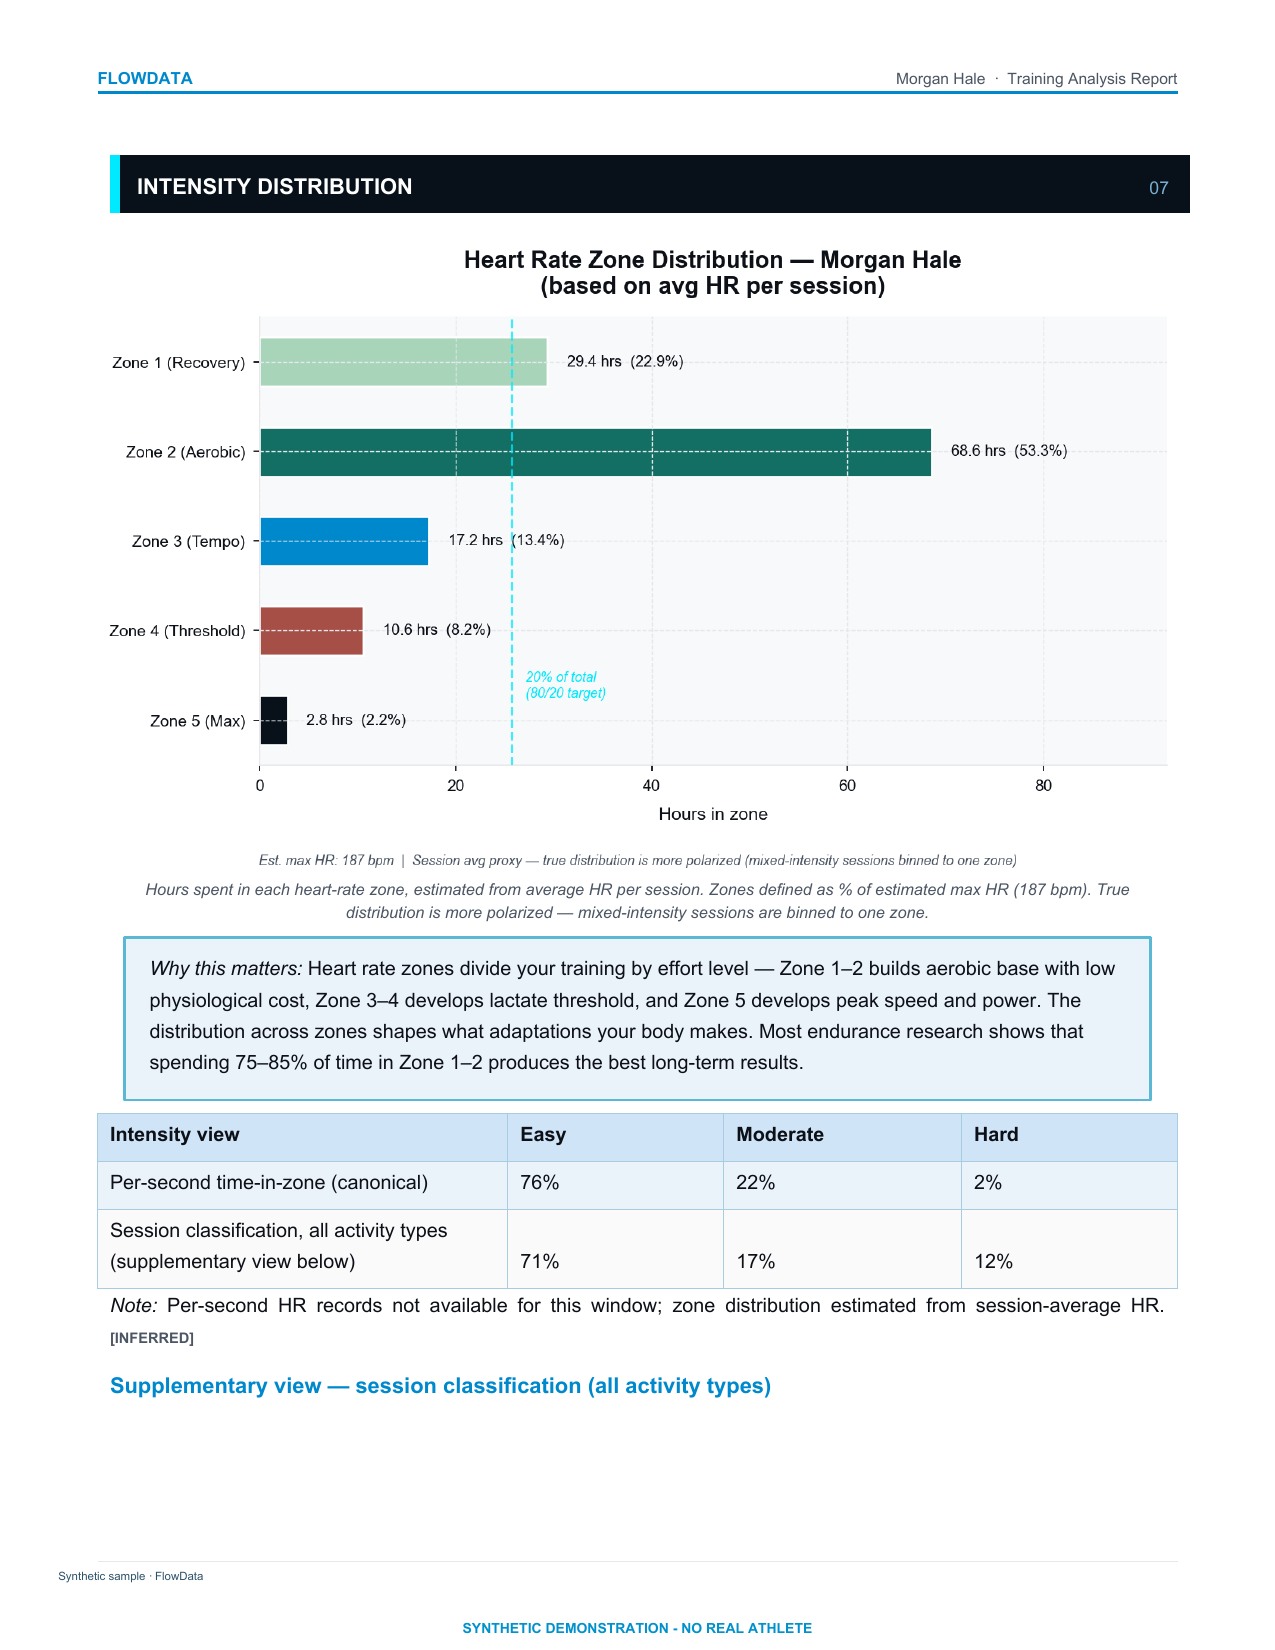
Morgan Hale synthetic intensity page comparing heart-rate-zone time with session-level classifications. Open larger

04

Intensity reconciliation

FlowData compares second-by-second zone time with whole-session labels and explains why the two views may disagree.

Warm-ups, cooldowns, mixed sessions, and different zone definitions stop being a contradiction and become useful training context.

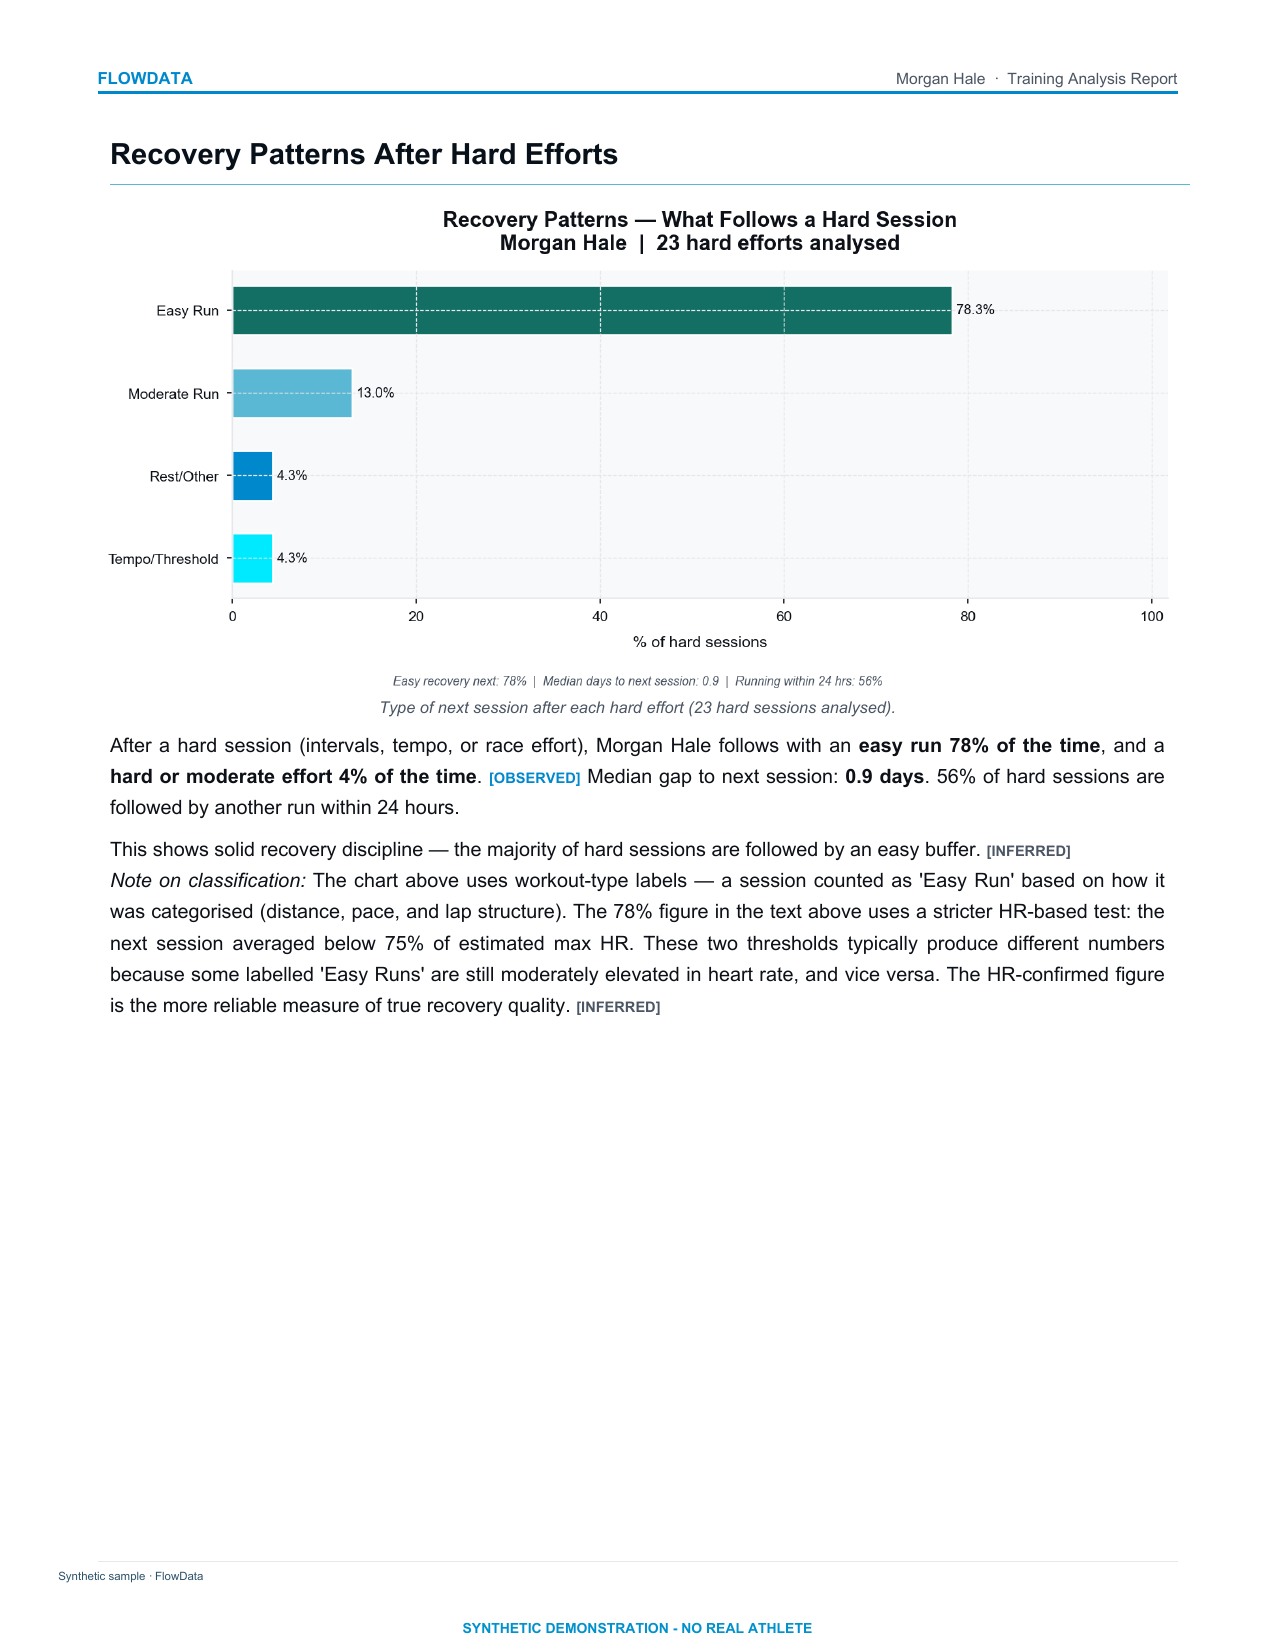
Morgan Hale synthetic recovery page showing what sessions followed hard training efforts. Open larger

05

Recovery sequencing

The analysis asks what happened after hard work: easy running, rest, another demanding session, or an unrecorded gap.

Workout order can reveal accumulated stress and recovery discipline that weekly totals alone cannot show.

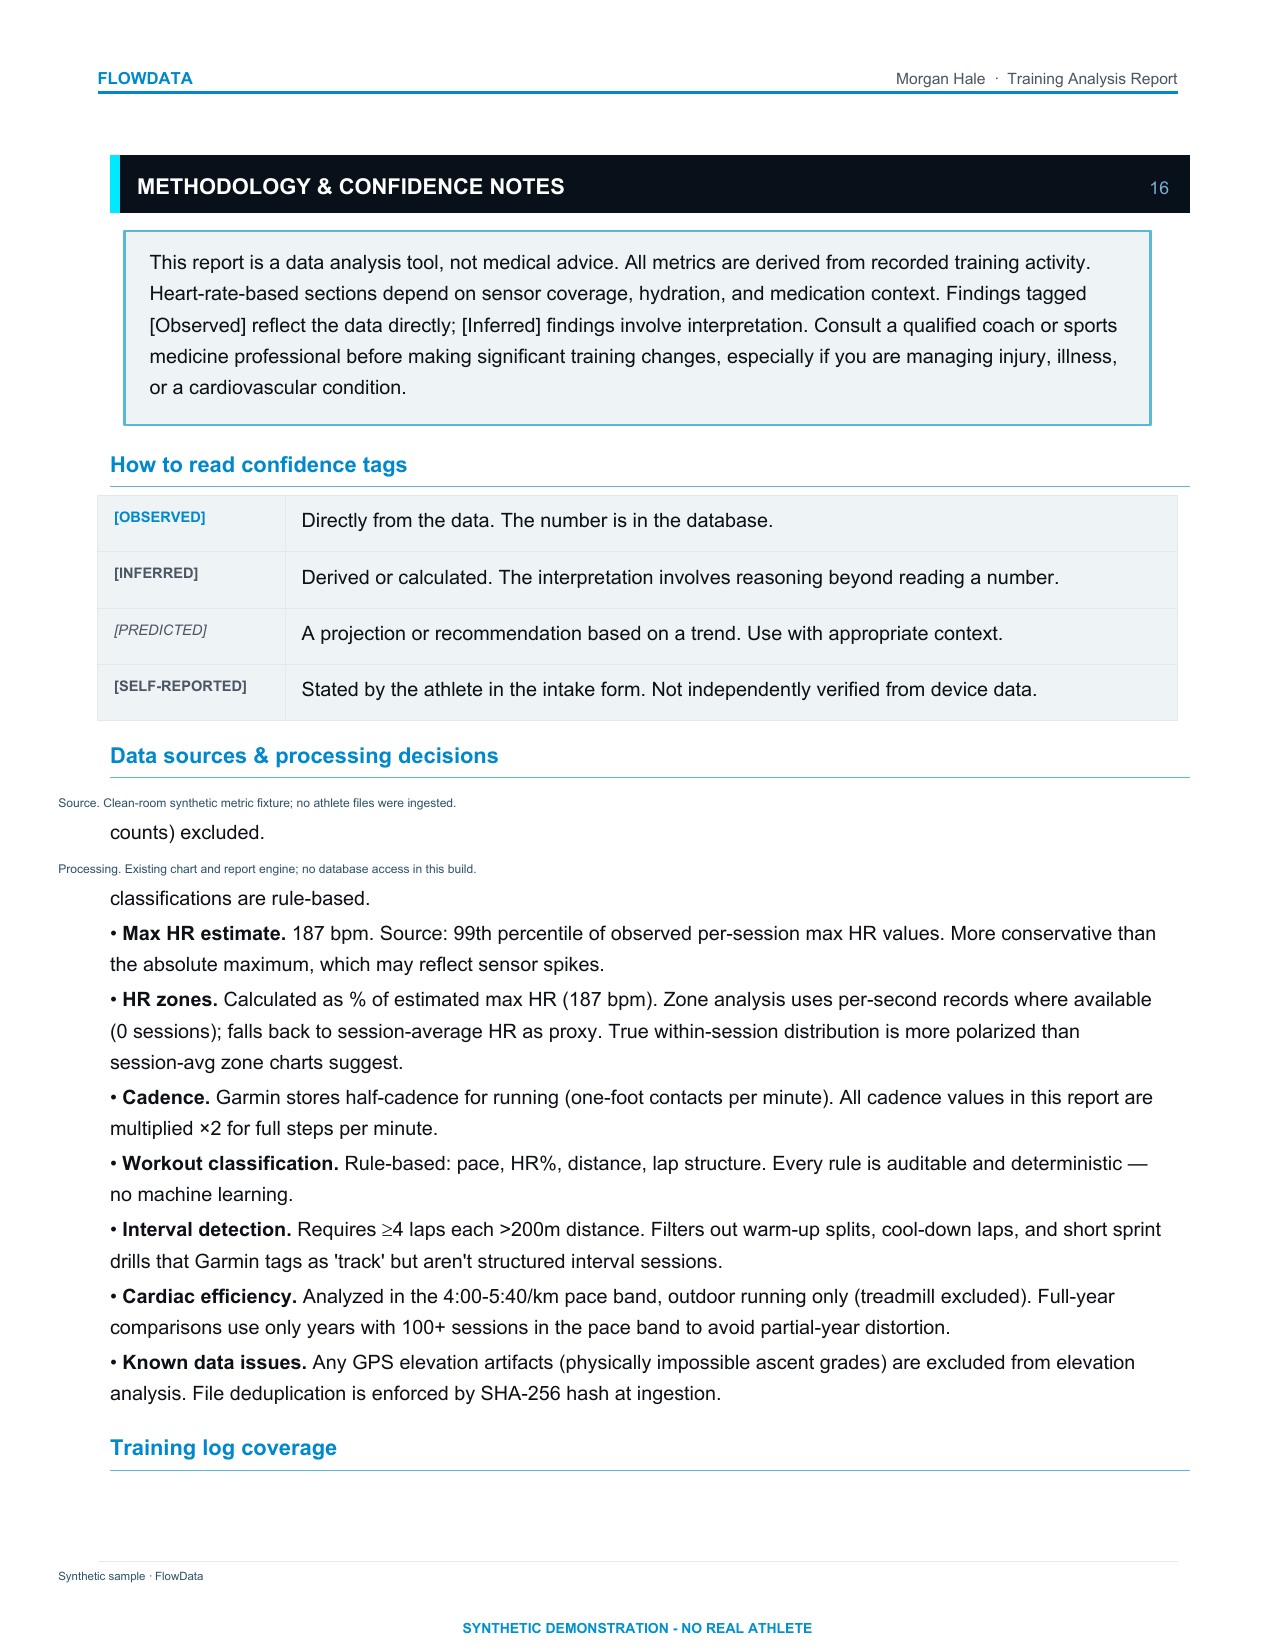
Morgan Hale synthetic methodology page explaining observed, inferred, predicted, and self-reported evidence boundaries. Open larger

06

Method and confidence

Every analytical layer is bounded: recorded facts, derived interpretations, projections, and athlete-supplied context are identified separately.

Readers can use the analysis without mistaking an inference for a measurement or a directional estimate for a guarantee.

THE COMPLETE ARTIFACT

Go beyond the six-page tour.

The full report includes 26 pages of training structure, durability, load, confidence notes, and decision-ready recommendations.

Open complete PDF · 1.5 MB

TWO WAYS TO USE FLOWDATA

Choose the path that fits.

COACHES & CLINICS

Reports for your athletes

Add a source-labeled analysis product for the runners, patients, or members you already support.

Explore partner reports

INDIVIDUAL RUNNERS

Analyze my training

Turn your own device files and running context into a report built from the same analysis engine.

Explore running analysis

Sample report page